Property for sale in Odiham preview

Property for sale in Hampshire.

If your leaving #London or any other city to escape to the country, then do take a look at this property preview of a character home set in rural Hampshire; due to the open market soon with an anticipated guide of £1.1m.

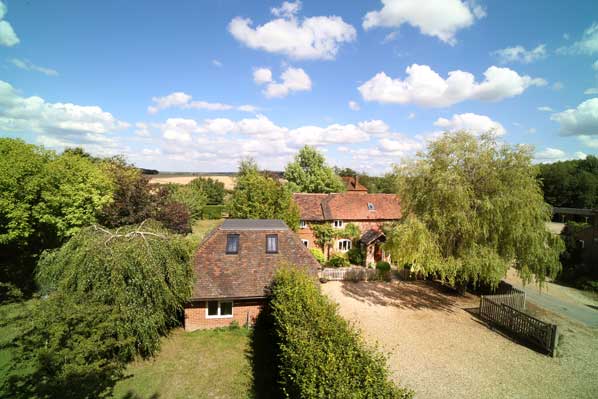
Located on the outskirts of Odiham Village and surrounded by open countryside, this is an attractive converted and extended former stables, which occupies a plot of approximately an acre.

The Stables was converted by the current owners 25 years ago, and the photos and video created by John Joe showcase this beautiful four bedroom detached family home which has an abundance of character throughout, including exposed beams and brickwork as well as wood burning stoves in both the main lounge and family room.

kitchen photo

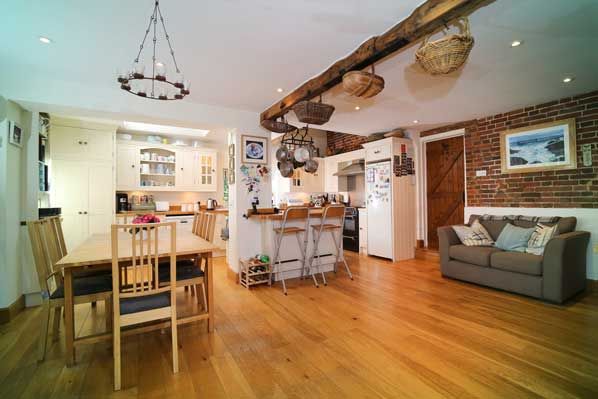
Upon entering the property you are met by an entrance hall which provides access to the living room and family room, both of which are double aspect. At the back of the property is the spacious country fit open plan kitchen/dining/family room with double doors leading to an outside patio area and the generous grounds. There is also access to the downstairs cloakroom and separate utility/boot room with side access to the garden.

Upstairs there are four bedrooms, with the master bedroom benefitting from an en-suite bathroom, and a family bathroom. All bedrooms have built in wardrobes and there is additional storage on the landing with a linen cupboard and space in the eaves.

The property is accessed via a double five bar gate which takes you through to the gravel driveway providing parking for a number of vehicles. There is also a detached double garage which has the added benefit of an office space on the first floor.

garden view

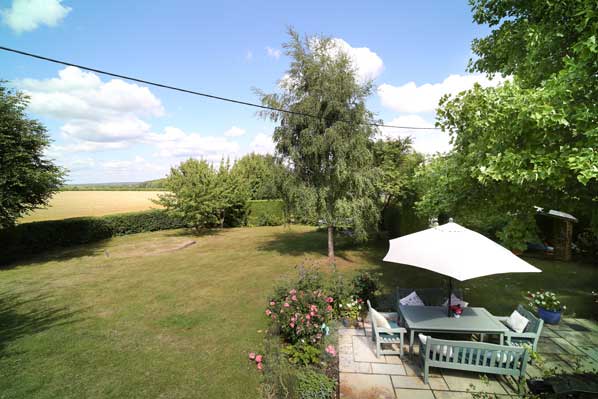
The private garden is mainly laid to lawn with a number of mature shrubs and trees, as well as an area of orchard. There is a large stone patio area, ideal for alfresco dining, which is the perfect place to take in the adjacent countryside views. Additionally there is a summer house and a shed that is located next to the greenhouse and vegetable patch.

Odiham is ideally located for access to London via Hook mainline station along with M3 access via junction 5. There are a number of shops and restaurants, a thriving cricket club and tennis club with excellent schools also on offer. Nearby towns such as Farnham, Fleet, Basingstoke and Reading are a short drive away and provide further shopping and recreational facilities.

Contact our Odiham branch on 01256 704851

photo property for sale hampshire odiham

Property Preview – New To The Market

This property in around 2.5 acres(not yet checked or measured), is new to the market today so we have rushed to get the preview video to potential buyers.

The anticipated guide price is around £1.2m. and the property, which is located in Rotherwick, will be of particular interest to the equestrian enthusiast. Telephone 01252 84200 for further details.

Housing Wealth Hotspots In Britain’s Major Cities Revealed

Housing Wealth Hotspots
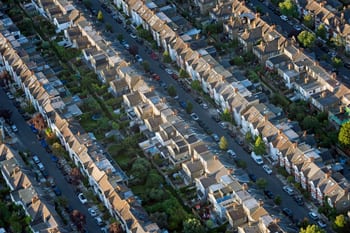
London Tops The Tables

The total value of London’s homes is now over £1.5 trillion – more than twice the value of Britain’s next nine largest cities combined – analysis has found. Zoopla made the findings after analysing property values in Britain’s 10 largest cities.

It found the total value of London’s housing has increased by 1.54% over the past 12 months – the slowest growth rate of any of the top 10 cities. Sheffield had the highest annual growth rate at 5.63%, followed by Glasgow at 5.38% and Manchester at 4.49%. Bristol is the next most valuable city after London, with homes there worth an estimated £115.21 billion. Bristol is the only city in Britain apart from London where the total value of homes is over £100 billion.

Glasgow is in third place with a property market value of £90.75 billion, having also seen particularly strong growth in property values over the past year compared with the other major cities. Lawrence Hall, a spokesman for Zoopla, said: “It comes as no surprise that London is significantly more valuable as a residential property market than any other British city. “However, the data does show that, in comparison to cities further north and across the Scottish border, the rate of growth in London has slowed.”

The research also looked at the pockets in each city where total property values are particularly high. Within London, the SW1 area, which includes Belgravia, Pimlico and Westminster, was identified as being the most valuable area of the capital. Homes there are worth £54.57 billion in total – nearly as much as the whole of Sheffield’s housing – according to these estimates.

Bristol’s BS16 neighbourhood was identified as the city’s most valuable enclave, with a total value of £10.1 billion. The area includes Downend, Emersons Green, Fishponds, French, Pucklechurch and Staple Hill.

In Glasgow, G12, which includes the West End and the University of Glasgow, has a total property value of £4.27 billion, while Birmingham’s most valuable area is B13, including Moseley and Billesley, with a total value of £3.97 billion, according to the findings.

Meanwhile, homes in the M20 area of Manchester, which includes Didsbury and Withington, are valued at a total of £6.48 billion.

Summary / Conclusion

At McCarthy Holden there was no surprise in London topping the tables, however there is an interesting trend currently because there is a significant uplift in buyers leaving London to find a new home and settle in places like Fleet, Odiham and Hartley Wintney, perhaps indicating that lifestyle and environmental criteria play an important a part in moving house.

Here is the annual percentage growth in the value of homes, according to the research, followed by the total value in January 2018:

1. London, 1.54%, £1.506 trillion

2. Bristol, 3.8%, £115.21 billion

3. Glasgow, 5.38% £90.75 billion

4. Birmingham, 4.08%, £81.66 billion

5. Manchester, 4.49%, £80.47 billion

6. Edinburgh, 4.04%, £68.27 billion

7. Nottingham, 3.69%, £66.13 billion

8. Reading, 2.37%, £60.55 billion

9. Leeds, 4.2%, £59.05 billion

10. Sheffield, 5.63%, £55.69 billion

And here are the most valuable areas in each of the top 10 cities and the annual percentage growth in their value, according to Zoopla (cities ranked in order of the total housing value in each city):

1. London, SW1, includes Belgravia, Pimlico, Westminster, 0.01%, £54.57 billion

2. Bristol, BS16, includes Downend, Emersons Green, Fishponds, 4.43%, £10.1 billion

3. Glasgow, G12, includes West End, Cleveden, Dowanhill, 7.18%, £4.27 billion

4. Birmingham, B13, includes Moseley, Billesley,  5.37%, £3.97 billion

5. Manchester, M20, includes Didsbury, Withington, 4.78%, £6.48 billion

6. Edinburgh EH4, includes Dean Village, Comely Bank, 5.09%, £8.61 billion

7. Nottingham, NG9, includes Beeston, Stapleford, Lenton Abbey, 5.31%, £6.93 billion

8. Reading, RG4, includes Caversham, Sonning, Sonning Common, 1.23%, £8.54 billion

9. Leeds, LS17, includes Alwoodley, Bardsey, East Keswick, Eccup, 5.63%, £6.46 billion

10. Sheffield, S10 includes Broomhill, Broomhall, Crookes, 5.39%, £5.68 billion

So you’re just about to become a first time landlord?

How choosing the wrong letting agent will make you cry…

It happens more often than you think.You might get a new job offer that’s too good to turn down, you may decide to move in with your partner or you may just fancy a change of scenery and take some time out traveling.

The thing is, what do you do with your home? You could sell it, and reinvest the money, although returns on most things are very poor nowadays, as well as taking on a large amount of risk. So why not keep it?

If you keep it, you can either leave it sat empty and have a friend or family member check on it every once and a while, or you could let it out and hopefully make additional income along the way.

This is where doubts start to creep in…this is where becoming a first time landlord really can start you off worrying about your home that you have painstakingly improved and maintained over the years. There are so many horror stories about people renting out their homes from tenants not paying the bills, blocking the drains, decorating in unsuitable colours to running illegal ‘so-called businesses’. The problem is that a lot of dysfunctional, criminal, deranged or antisocial people can, when the occasion demands, give an impression of being an upstanding trustworthy member of society.

Unfortunately, without carrying out the right checks and trying to mitigate the risk as much as possible you may find, to your cost, that you end up with an unsavory character renting out your home.

Even if you do carry out the right checks, there is always the chance of things going wrong …way into the time scale of the tenancy. For example, what happens if the tenant stops paying, for no apparent reason? This can really start to cause cash flow issues.

There are also the legal obligations of being a landlord. Falling foul of the law can end up costing you an awful lot of money. For example, failure to comply with gas safety regulations could lead to prosecution and/or imprisonment with fines up to £25,000. Then, of course, there is the legal requirement to put your tenant’s deposit into a government-backed tenancy deposit scheme (TDS) See details about ‘Tenancy deposit protection’ on the UK Gov. website.https://www.gov.uk/tenancy-deposit-protection

So the choice is yours… do it yourself or bring in a Letting Agent to help you.

So what should you really be looking out for in a lettings agency?

There are a few things that your letting agent must cover without a shadow of a doubt. If they can’t help you with these five things…then stay well clear.

  • Processes and measures in place for finding the right tenants
  • Health and Safety – complying with the law
  • Optimising rental income
  • Tenancy deposit scheme
  • Comprehensive tenancy agreement

Accreditations
Choose a letting agent who is a member of the National Approved Letting Scheme (NALS), or one of the professional bodies that support it.

– The Association of Residential Letting Agents (ARLA/Property Mark)

– The Royal Institution of Chartered Surveyors (RICS)

– The National Association of Estate Agents (NAEA)

Level of service
Can the agent offer you different levels of service, from full management to just finding a tenant, depending on your requirements?

Do they have professional indemnity insurance?
This will cover the letting agent against the possibility of being sued. Do they also have a client money protection policy in place

Tenancy deposit scheme (TDS)
Can the letting agent deal with this for you? If so, check that the scheme they belong is a government-backed reputable scheme.

Ongoing support
Does the agency undertake regular property visits to check up on the state of the property and the wellbeing of your tenants?
Is there an emergency maintenance out of hours contact number available?

These are just a few of the things you should consider when renting out your home for the first time. However, there is nothing like meeting up with the letting agent, to see what they are like in person. Do they get on with you, how helpful do they seem? How knowledgeable are the staff, and are they continuously being trained (CPD courses) on the latest legislation for example.

Also, check out a post by ARLA on “How to find a good Letting Agent”
https://www.ukala.org.uk/agents/press/releases/how-find-good-letting-agent

UK Residential Property In £ Per Square Metre

Local property hotspots in areas such as the Blue Triange in Fleet and the Cricket Green in Hartley Wintney have seen £ per square metre levels as high as £4,304 and £6,521 respectively, which sounds robust so how does that compare to other parts of the UK? These hotspot figures do not represent an average for the area, so bear this in mind when reading the following.

One square metre of house space in Kensington and Chelsea is 25 times more expensive than the cheapest area of England and Wales, new figures show.

The London borough tops the list for the costliest house price per area, with homebuyers paying almost £19,500 per square metre last year.

By contrast, the amount paid in Blaenau Gwent in Wales was £777, according to the Office for National Statistics (ONS).

Prices in the capital continued to soar far above other regions, with the cost per area almost doubling to £6,639 between 2004 and 2016.

The five boroughs with the steepest house prices per square metre were all in London, with the City of London (£17,371), City of Westminster (£16,246), Camden (£12,671) and Hammersmith and Fulham (£10,718) following Kensington and Chelsea.

Three of the five areas with the lowest cost per square metre were in Wales, with Merthyr Tydfil and Neath Port Talbot clocking in at £917 and £984 respectively.

They were joined by Burnley (£838) and Hyndburn (£976) in Lancashire.

The figures showed the north-south gap continues to widen, with prices in the South East (£3,445) almost double that of the North East (£1,271).

The data covers houses and flats bought in England and Wales between 2004 and 2016.

While there was a slight increase (2.7%) in the size of floor space bought, the rise in house prices was the main driver of growth, the ONS said.

Price per habitable room in England and Wales increased by almost half (45%) in the same period, whereas room size only increased by just over 1%.

A room in London cost almost £133,000 last year, almost four-and-a-half times more than those in the North East, with an average of around £29,700.

A boost in the proportion of detached homes purchased, along with a fall in the proportion of flats bought, account for the slight increase in room size.

Main Source: Isabel Togoh, Press Association

Market Insight and head scratching!

With our half year productivity up on last year and a record amount of property sale exchanges anticipated in July, are we really at odds with some of the negative press coverage around right now? Thankfully we are finished with General Elections and Referendums, for a while at least. The last three years have seen the residential house market disrupted in the lead up to these events, typically bringing a slow down in activity pre-event, followed by a rapid uptake in transactions post. The problem with most media coverage is that they work on house sales completions, which inevitably reflect a market three or four months prior and thus bear little relevance to the market occurring now today.

With the 2017 General Election firmly behind us, we can now look at the winners, who in property terms were the buyers who took the plunge and negotiated a deal pre-election. The wise buyers took advantage of a typical modest slow down in activity in the lead up to the General Election. Now, the market pace is set to rise during the remainder of 2017 and this is shown in our June and July 2017 productivity levels.

A Productive 2017

We have are already experiencing some record new ‘Sales Arranged’ figures this year, so we are optimistic about trading levels for 2017. Our house sales income at the half year point was up on last year and July is expected to finish with a record house sales income level. This doesn’t mean house prices are increasing, but instead it means the volumes of sales is on the up and buyers are being decisive, partly influenced no doubt by a shortage of supply which is a UK wide problem as the RICS survey out today reports by stating that new instructions had fallen for the 16th month in a row.

We look forward to a further review of the market late Summer / Autumn, when it will be time to check in on our market predictions. In the mean time our summer lifestyle and property magazine In The Country and Town is being read in thousands by potential buyers, investors and influencers alike.

The Rental Market

The Government is likely to ban tenant fees and this will result in agents charging Landlords higher fees, in order to recoup the costs of creating a lease and security checking a suitable tenant. The net result for tenants will be increased rents. ARLA, the industry professional body, recently stated that it does not support the fees ban, and that fees represent a legitimate cost to business that needs to be covered.

In many ways tenant fees are akin to house buyer fees, where referencing checks equate to mortgage application fees, contract negotiation charges are akin to conveyancing costs and inventory costs are similar to a survey cost.

The reality is that in order for a Landlord to be protected, many pre tenancy actions need to be undertaken and the cost of delivering these services has to be met in order to put in place the necessary safeguards.

In our area of operation, there is no evidence of Investment Landlords selling up as their profits start to dwindle due to the phasing out of tax relief on mortgage interest in April. Landlords will however seek to produce profit, and tax burdens together with the migration of tenant fees will force them to seek ever increasing levels of rent.

Lets Go!

We can look forward to some exciting new beginnings ahead and Brexit with all its uncertainty should be engaged with, and not seen as a doom-laden event. Remember there has not been the immediate 18% reduction in house prices post Referendum as predicted by George Osborne, nor many of the other horrific economic events. Many believe that sooner or later we will suffer, and that calamity will befall us in due course, but now is the time to focus on prospering and adopting a positive innovative attitude to our future; especially by business and industry in general.

For the remainder of 2017 I believe the residential housing market will be in good shape. This doesn’t necessarily mean a growth in property values, but it does mean that properties will sell faster and the number of transactions will be increased.

This in some way is also reflected in the experiences of the housing market in the United States, where there are some very similar scenarios. Like the UK, prices are continuing to rise despite political and economic uncertainty and some of the main reasons are also the same, namely a lack of supply. Prices for US housing is higher than April 2016 and this is having an effect on first time buyers and second movers, both groups that are essential for a healthy housing market. Also, rising rents mean that tenants hoping to buy find it harder to save for a deposit. A major difference between the two housing markets is that interest rates are rising in the US.

From a UK perspective there are some similar influences. It has been said that an interest rate rise would dampen the market, but this has not happened in the US. It was said that Brexit would have an effect, but it hasn’t. In both the US and UK more new homes are needed but this is not going to happen overnight and could take a decade to sort out.

I am confident about a positive output in 2017 and this confidence spills over into decision making about investment recruitment etc., so our corporate eyes are set firmly on making 2017 work well.

John Holden

Chairman and Managing Director

McCarthy Holden

2016 Property Market Review – So, is it all’s well that ends well, despite Brexit, being Trumped and embracing the unexpected

Reading recent industry reports(source EYE) about major UK agents closing branches and planning staff redundancies, these are indicators that all may not be well for house sellers and agents alike. However, behind the difficult times in 2016 there are key factors which influenced poor productivity. Understanding these drivers paints a picture of a house market economy in reasonable shape, which has been buffeted by events and storms, but importantly these events haven’t altered the direction of travel. 

In part the 2016 UK residential property market has mirrored the chaotic and unexpected political turmoil in the UK and USA, however a calm but clear upturn has come into place at the end of this year albeit as a last lap surge, without which the 2016 property market review would have been a somewhat gloomy picture. 

Market Drivers in 2016 – A lot to answer for by George!

At McCarthy Holden, larger town branches usually give a good indicator of the health of the housing market and during November our Fleet branch alone exchanged contracts on over £10m. worth of property sales. Furthermore they replenished this with almost the same amount in new sales arranged for the month. This was more than a healthy result for a November, and an outcome that was in the making back in September when the market really started to get moving fro the first time this year.

The key negative impacts during 2016 are clear. At the top end of the market (£2.0m. plus) the 2015 actions of George Osborne on hiking stamp duty levels directly caused a downturn in house sales activity and productivity. The populist political stance of clobbering the wealthy with increased stamp duty levels resulted in less revenue for HMRC, so this political and misjudged gesture resulted in less wealth for the UK in tax receipts. Furthermore, this reduced the level of top end house sellers coming to the market cutting off the house stock resources which normally drives the will to trade up. Result, a net negative impact and less housing stock on the market with resultant lower volumes of sales. Will new Chancellor Philip Hammond reverse this by ditching the policies of his predecessor George Osborne? On purely economic grounds and to improved tax revenue he should, but then again politicians are notorious for not listening and are London centric in their policy making.

In the UK during the six months from May to October there was a 75% reduction in sales of properties above £10m – down to just 15 from 61 in the same period last year. There was also a 51% reduction in sales between £5m and £10m – a fall from 201 to 99.

While there might not be much sympathy for this segment, there must nevertheless be concerns about a market that needs to flow freely from the top. Furthermore this reduced activity has a massive impact on the wider economy (carpet fitters, decorators, landscape gardeners, kitchen suppliers) because a house move always brings about change.

Overall there is speculation that the loss in tax revenue from stamp duty changes could be as much as £1bn. by the end of the financial year! (source Property Wire)

Many had been expecting a U-turn on stamp duty both in the buy to let and high end property sectors. However, not a hint was seen from Hammond in the recent Autumn statement and all that was referenced was the need to build more houses, thus repeating the same old refrain but failing to be pro-active.

With regard to productivity in the general house market (say £200,000 to £2.0m) the market is ending the year in good shape, but you wouldn’t have predicted that outcome during the first half of the year. The Q1 and Q2 trading on house sales was impacted by the EU referendum, so in the lead up to this both buyers and sellers simply held back and went for the do nothing option. Many economic commentators around this time were on the band wagon of house price falls and a market about to crash – it wasn’t it was just on hold because post Brexit it was like Christmas had come early on the house sales front. Buyer enquiry uptake was almost immediate and house sales were on the up, boosted in some part by American buyers keen to cash in on the pound dollar exchange rate movement.

London Market Declines – so what impact beyond the City?

During 2016, house prices have fallen dramatically in London but readers should not confuse this with a UK trend. London alone has in recent years suffered or benefited (depending on which side of the fence one sits) from vast house price increases due in the main to overseas investment. Such an influence skews the market, however the market outside of London has not been impacted in the same way so there is nothing to correct, hence why property prices in the main remain on a steady upward direction outside of London.

Last lap rally for house sales!

So from June onwards a steady and improving house market was developing, but of course the sales arranged in June and July take typically three months to complete. The real turnaround in house sales productivity therefore is only being seen in the last quarter of 2016, as a last lap surge and greeted with relief no doubt by agents and vendors alike.

Now, looking ahead we can see a positive close to 2016 which should set the scene for a steady 2017. In October 2016 there was good news that mortgage approvals had increased and based on McCarthy Holden’s performance on new sales arranged in November this trend will continue.

The year ahead?

Going into 2017 the mainstream housing market is in surprisingly good health and seemingly ready to absorb any uncertainty around the Brexit process.

At the top end, it could be a good time for buyers to get off the fence because if there is a downward adjustment in top end stamp duty then such a correction could easily be offset by an uplift in prices in the over £2.0m sector – something that hasn’t occurred for several years.

My top tip is to encourage buyers looking over £2.0m, to jump off the fence, because  in this sector it could well be the time for buyers to to take a risk before prices move upwards after years of poor performance. Blink and you could miss the opportunity so start you property search here.

For 2017 the mainstream market should be steady with house price remaining static or showing a small increase (outside of London).

My business take on the year ahead is to keep tight cost controls, employ experienced property personnel, and don’t bank on planned outcomes; just stay close to your market, react swiftly and don’t be blown off course by the inevitable unexpected.

×
Find a Property
M
Country & Equestrian